Discrete-Time Signals
Formula sheet: (https://pipirima.top/2022-2023/Discrete-Time-formula-sheet-4d6b2d11b3d4/)
Frequency Analysis of Signals
Fourier transform usually used in aperiodic and continuous signals turning from time domain to frequency domain as:
The complex exponential can be explained as sine and cosn format:
Hence cos(x) only has real part and sin(x) only contains imagine part
| Continuous | Discrete | |
|---|---|---|
| Periodic | Fourier series | Discrete-time Fourier series |
| Aperiodic | Fourier transform | Discrete-time Fourier transform |

PDS(Power Density Spectra) of DTFS is:
PDS(Power Density Spectra) of DTFT is:
The Discrete Fourier Transform
DFT(Discrete Fourier Transform) is usually sampled by a finite period of DTFT(Discrete-time Fourier transform) signal, as it is easy to represented indigital system.
Like N is number of samples taken in one period, fs = sampled frequency, ∆t = sampled spacing time
If N>L, rest of N will be separated by zero points with no alising (or leakage?).
But if N < L, severial original descrete points will be ignored and deal with alising.
Hence normally N shold be > or = to L.

For real valued inputs, Re(x(n)) = x(n),
the transform is complex conjugate symmetric: X(k) = X*(-k) = X*(N - k),
Like X(1)=1+j=X*(-1) = X*(5 - 1)=X*(4)
FFT(fast Fourier transform) is a fast computer calculation mathod for Fourier transform. N for FFT should be a number with power of 2 (eg. 2,4,8,16,32,…). So if L of original signal is 30, its sampled number N will increased to 32 with 2 zero-padding points.
for signal cos(nπ/32), angular frequency ω=π/32, frequency f=2π/(π/32)=64Hz. And N=L=128, ∆t=2π/128=π/64. So there have 2 peaks seperatly on π/32 and -π/32 on frequency domain.
However, if peak frequency f not reaches intager times of ∆t, multiple non-zero samples will appeared which called the leakage.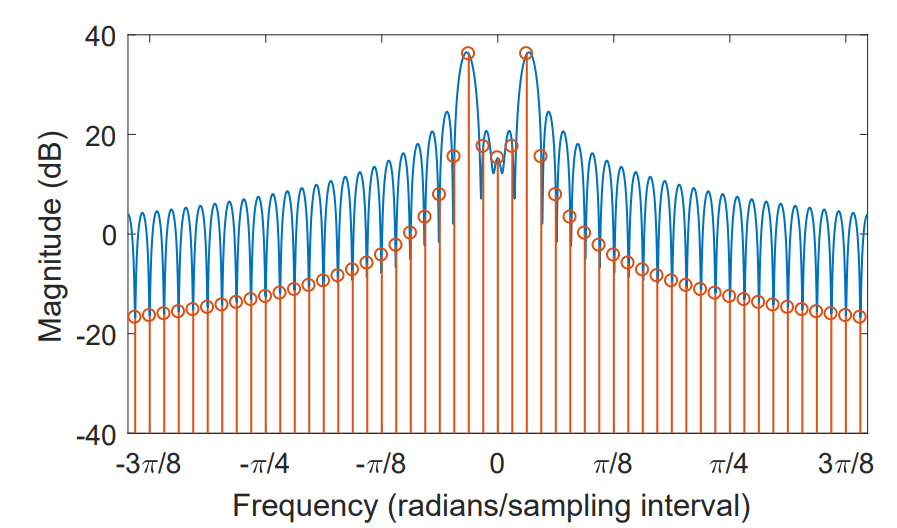
Which only two non-zero points should be sampled.
There have two methods to reduce the leakge. Sampling in frequency (zero padding and add more input samples) and Windowing.
With window method, the result signal will have a wider mainlobe nearing target frequency, and lower value away from peaklobes
The zero padding and add more input samples can be used after windowing. by increasing both N and L to 4 times bigger than before, the peaklobe will be 4 times narrow than origin plot.


Peak sidelob level can also called as dynamic range of transform
Correlation
Correlation is a technique that determines the relationship between two signals, allowing for a displacement in time.
Where the similarity of f(x) anf f(y) is large, rxy(l) will also be large
Where the similarity of f(x) anf f(y) is samll, rxy(l) will also be tiny
The correlation sequence rxy(l) is not symetric, as rxy(l)=ryx(-l)
Hence rxx(l)=rxx(-l), autocorrelation is symmetric.
rxx(0) = Ex is the energy of the sequence, if x(n) is a finite sequence.
The normalised correlations is defined to detect the strong level of a correlation system
When ρ is close to |1|, means the correlation is strong (fit with energy sequence).
For signal y(x) with finite sampling number M,
Transform of a Linear Time Invariant (LTI) system
The z-transform is a frequency representation of a signal, or system.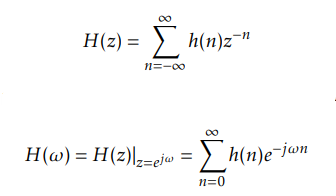
note z=exp(jω)
For causal systems to be stable, they must have all poles within the unit circle, although zeros are allowed at any location in the z-plane.
B(z) determines pole points, A(z) determines zero points

Sxx(ω) is the density spectrum of the system input, Syy(ω) is the density spectrum of the system output.

Hence |H(ω)|^2 is the discrete-time Fourier transform of the autocorrelation of the impulse response h(m)
|H(ω)| can be seen as the sum of dictence from a point which is on unit circle to all poles and zeros in this unit circle.
If we have two zeros 0 and -1, and also two poles -0.5 and 0.4, and choose the point where ω=exp(jπ/4),
|H(ω)| is total length of these four lines =1.713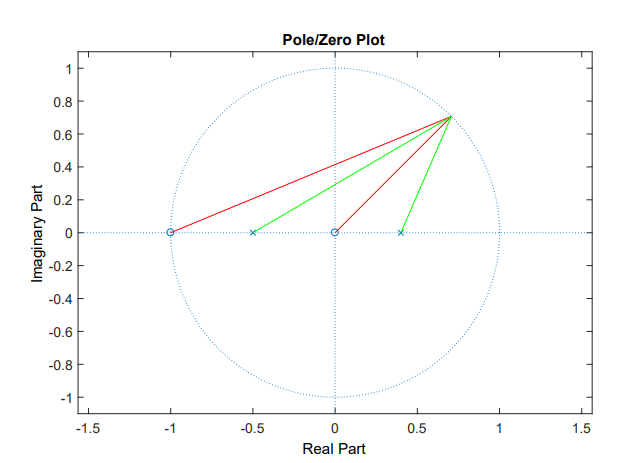
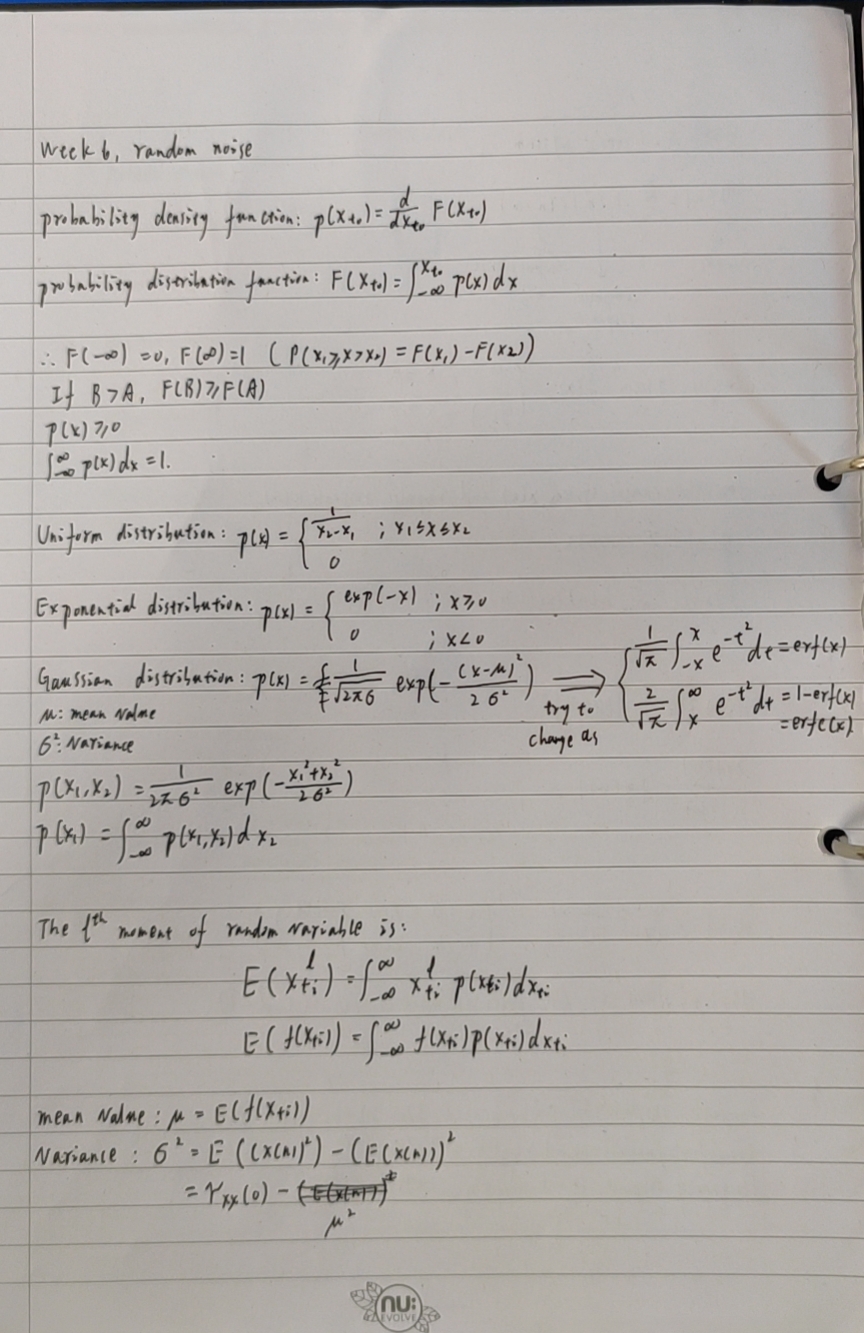
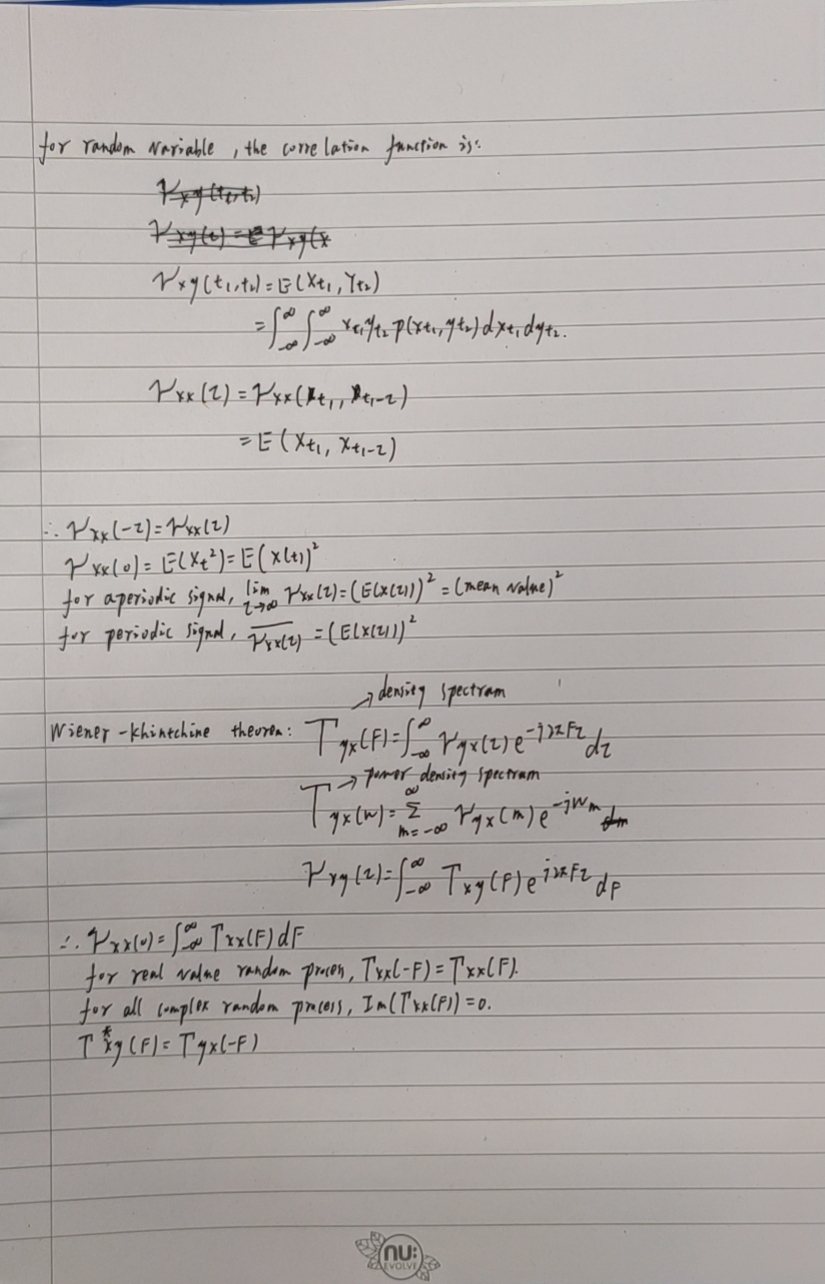
Random Signal
Digital Filters
There is a delay of an infinitelength before the output can be obtained
The filter requires future values of the input in order to determine the current output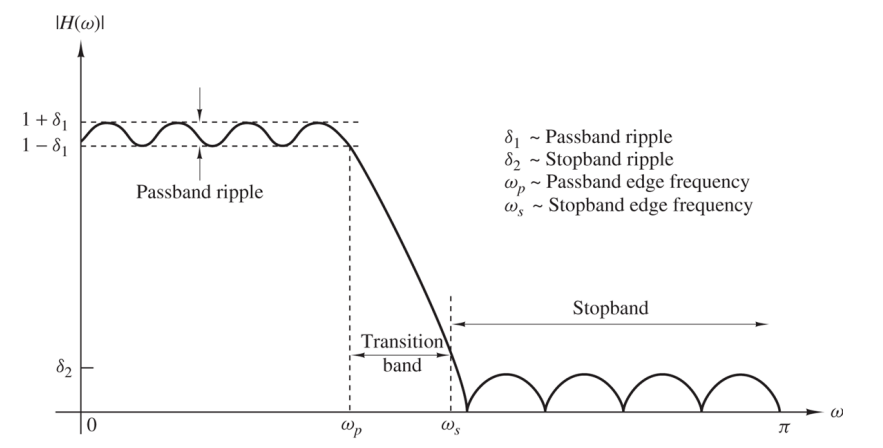
A practical filter will differ from the ideal with a frequency response. It may have ripple, and may not.
End edge of passband is the frequency drop below -3dB bandwidth frequency.
The stopband edge is the frequency at which the response drops to the desired stopband height.
reducing δ1, δ2 or the width of the transition band results in an increase in the other parameters
Linear phase is a property of a filter where the phase response of the filter is a linear function of frequency. The result is that all frequency components of the input signal are shifted in time (usually delayed) by the same constant amount.
The linear phase filte h(n) can be defined in pure real (evidente as left equation) and imaginary (evidente as right equation) frequency response
in real response, h(n)=h(-n), H(ω)=H(-ω), filter is symmetric
in imaginary reponse, h(n)=-h(-n), filter is anti-symmetric
equation of FIR is:
where h(n) is defined as the impulse response of a causal filter, M is number of taps
any zero that is real, and does not lie on z = 1 or z = −1 must have one other zero that is its reciprocal. eg. z2 and 1/z2
complex zeros, not lying on the unit circle, occur in groups of four. eg. z1, z1*, 1/z1, 1/z1*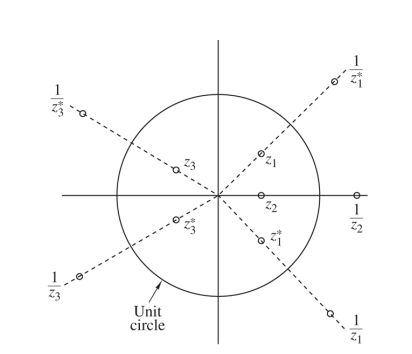
There have M-1 zero points for M-tap FIR filter normally.
Hence this figure shows an odd-tap filter.
If the filter is in even-tap, there must have zero equals 1 or -1 on circle.
depends on symmetrix or anti-symmetric
for Frequency response characteristics,

For a low-pass filter design, a symmetric response is required as an anti-symmetric filter places a zero at z = 1. For a high-pass design, a symmetric or an antisymmetric impulse response can be used provided that M is chosen such that a zero is not placed at z = −1.
For design a desired filter response, HRD(ω) defines the idealised filter. The idealised filter will either be symmetric, or antisymmetric (HRD(ω) = ±HRD(−ω))
To make the final filter of length M causal, a delay of (M−1)/2 samples is required.
For a low-pass filter design, a symmetric response is required as an anti-symmetric filter places a zero at z = 1. For a high-pass design, a symmetric or an antisymmetric impulse response can be used provided that M is chosen such that a zero is not placed at z = −1.
| filter | β |
|---|---|
| low pass | β=0 |
| high pass | β=1 |

like if sampled frequency=8kHz, and 16-tap filter, the shift frequency when α=0.5 is: 8k/2*16=0.25k
The transition bandwidth is: (transition_frequency/sampling_frequency)*2pi
which can get the number of filter taps
if calculated tap number is larger than designed number, then the calculated number can be seen as more complex
For Naïve approach:
The impulse response is based on DFT equation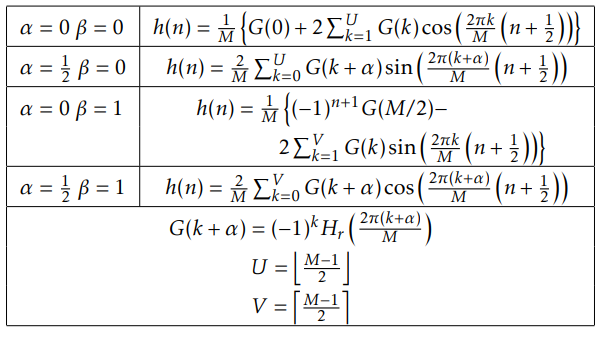
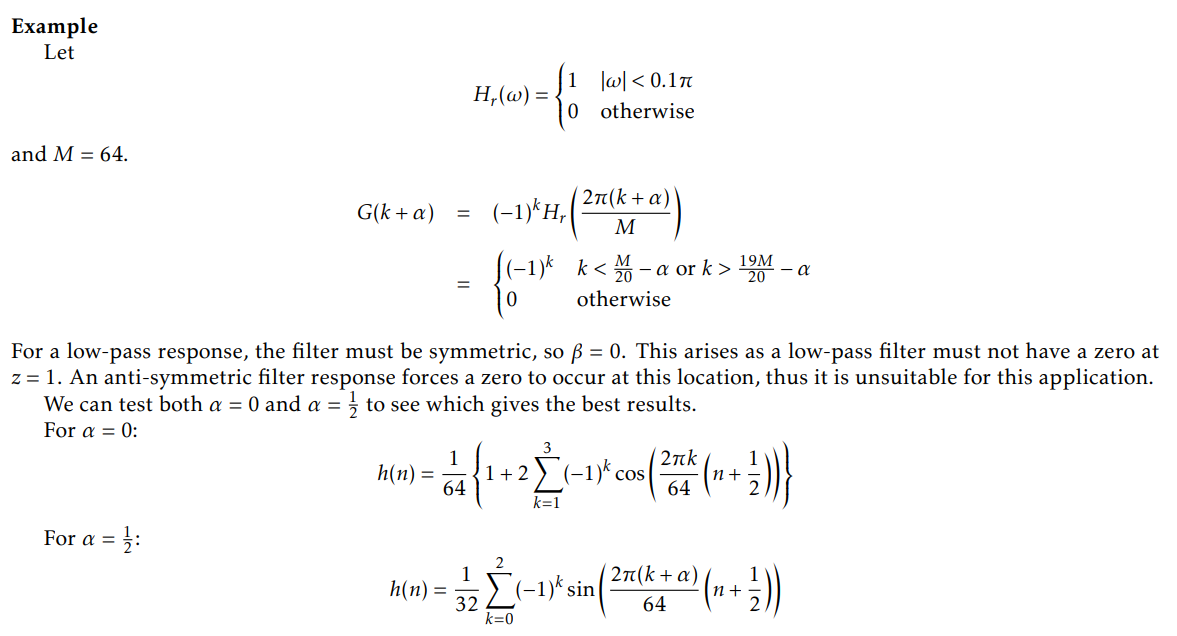
usually, the frequency repsonse when α = 0 has lower passband ripple but higher stopband ripple,
the frequency response when α = 0.5 has higher passband ripple but lower stopband ripple.
it should be careful to choose which filter is much better
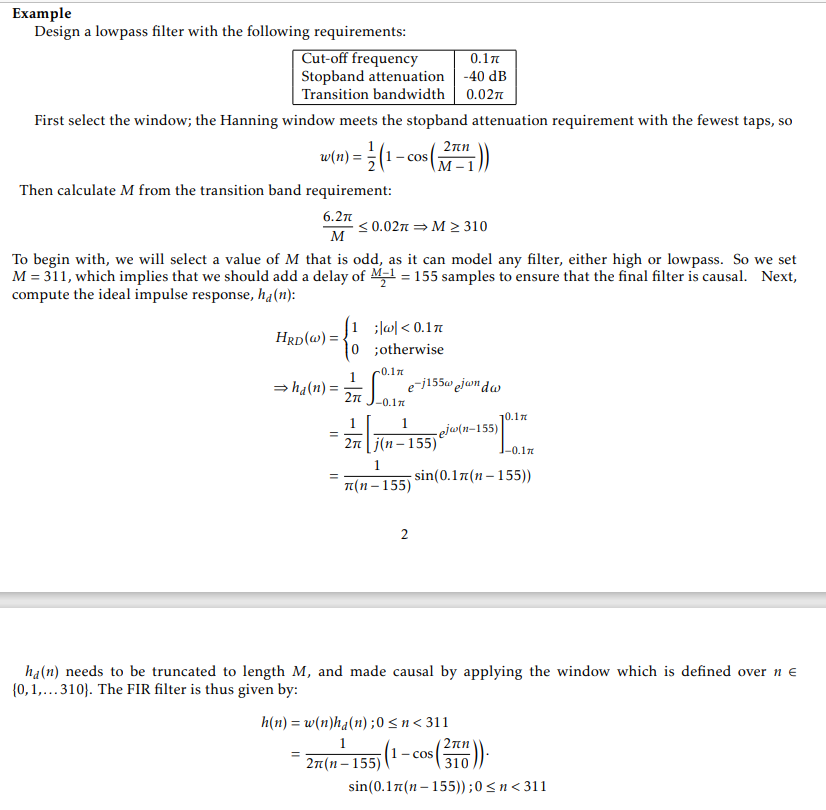
example: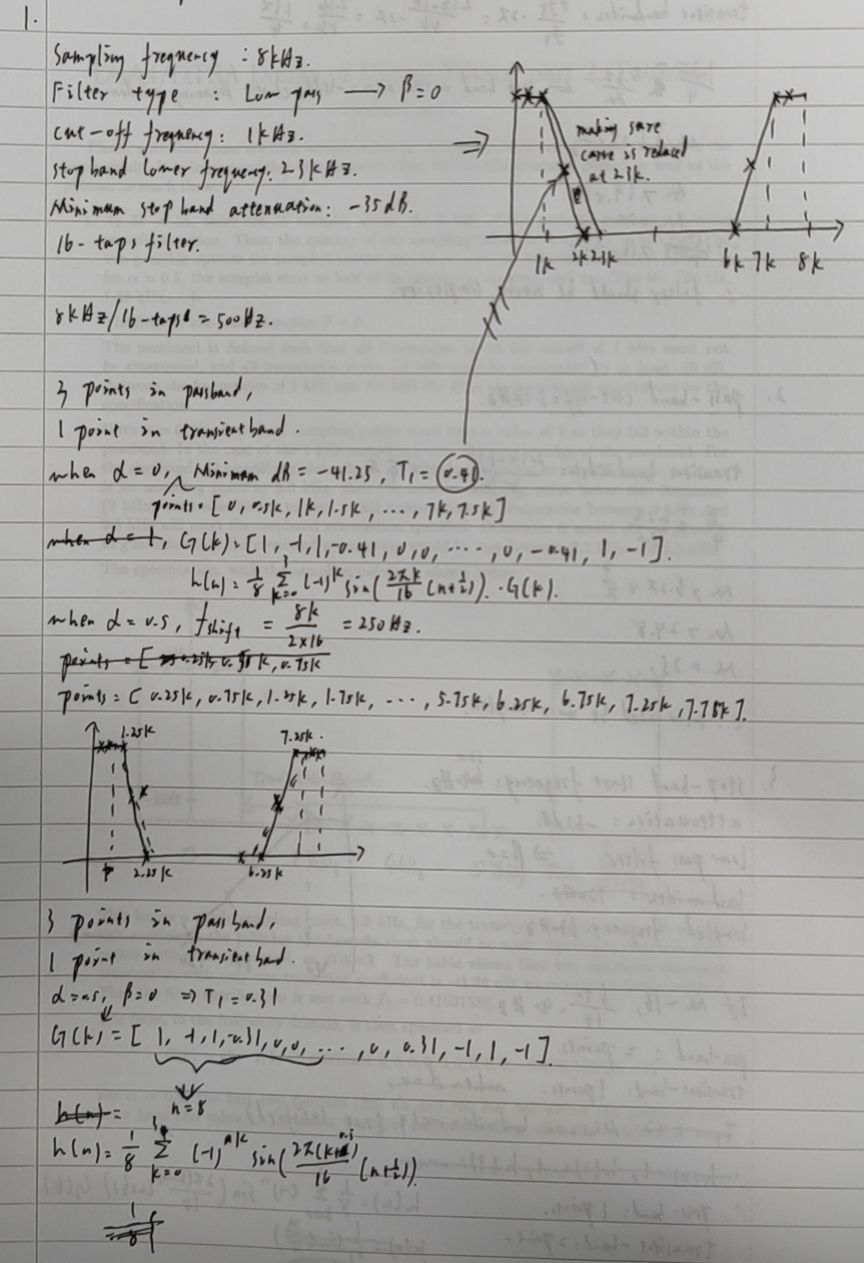
Power spectrum
The definition for an ergodic power signal can similarly be defined:
where N is number of samples, L is length of DFT sequence. Usually N less than L
But it is not a good idea to calculate whole priodic, as priodogram will have big variance and easy influenced by windowing
more detailed the sampling is, much bigger the variation is.
Bartlett method is transform each small blocks, and calculate its average value
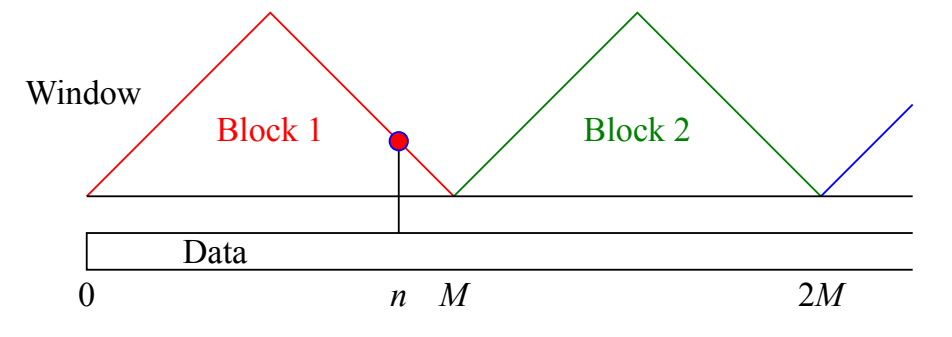
block number K=N/M
Welch method using more blocks with much less variation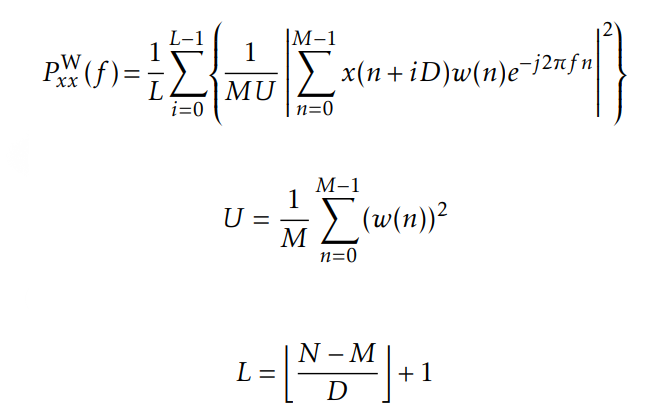
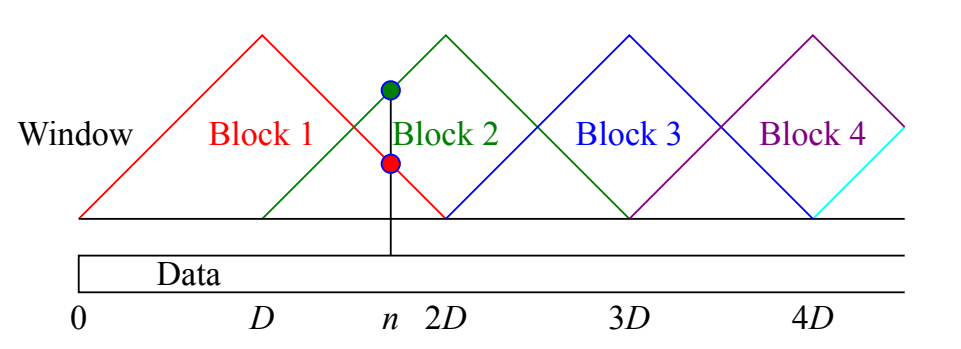
but divide block is same as add a rectangle window. Hence we can choose other window type to reduce spectrum leakage.
Note: narrower mainlobe, higher revolution. higher sidelobe, worse spectrum leakage
best choice is choose -30dB between mainlobe and sidelobe
Blackman and Tukey
this method will calculate correletion first and than calculate its DFT spectrum
value |m| shoud be less than M
value rxx(m)=0 for all |m|>M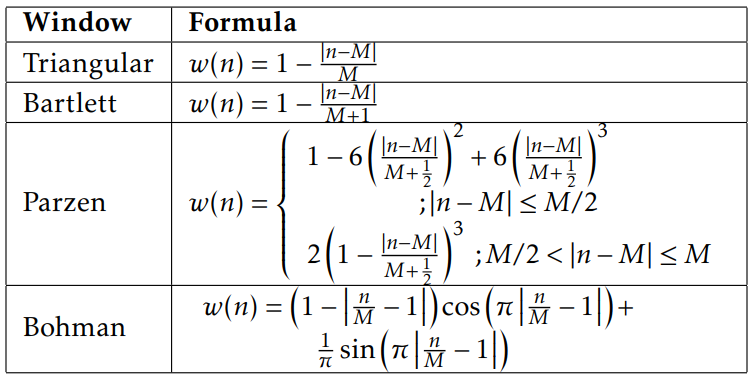
First two windows have high sidelobe and narrow mainlobe
Next two window have low sidelobe and wide mainlobe
Complexity
Techniques with a low computational complexity can be executed more quickly, and run more often, than those with a high complexity
multiplication is generally used as the metric to gauge complexity.
Multirate Digital Signal Processing
multirate techniques a signal, with a new sampling rate, that represents the original signal.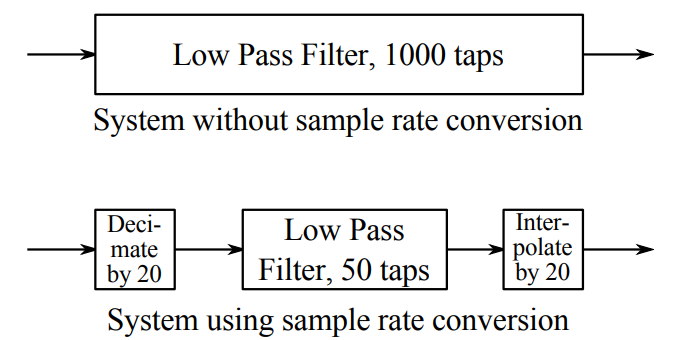
The multirate structure will could obviously decrease tap number in filter design
For resampling, D and I should all be integers
D is Decimation
I is Interpolation